
Client: Change Healthcare
Project: SDOH Dashboard Design
Objective: Create a dashboard that visualizes Social Determinants of Health data, enabling healthcare professionals to identify and address factors impacting patient health outcomes.
Problem Statement
Healthcare providers and decision-makers often face challenges in understanding and utilizing SDOH data effectively. Existing systems lack comprehensive visualization tools that integrate various social determinants, leading to gaps in addressing patient needs.
Crafted Solution
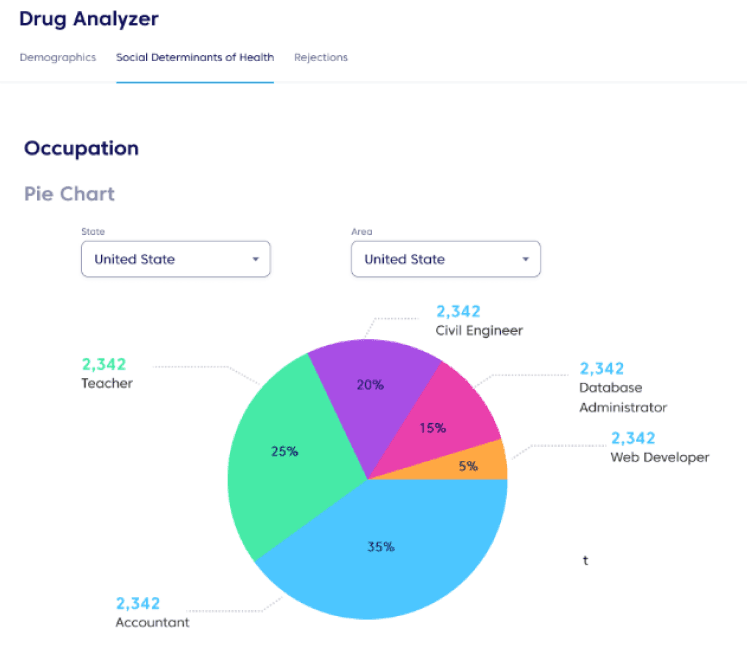
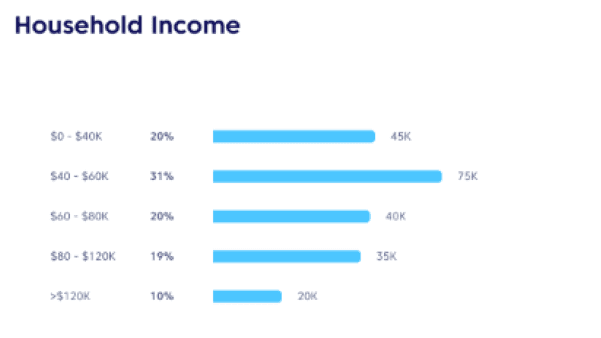
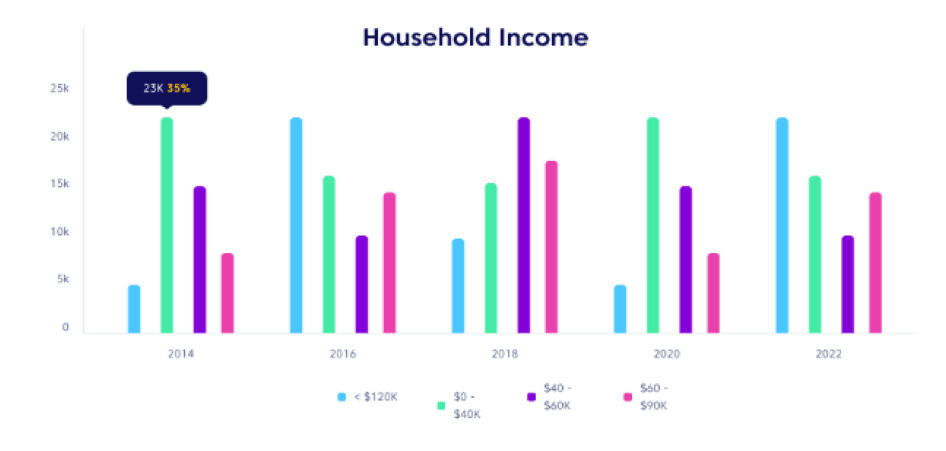
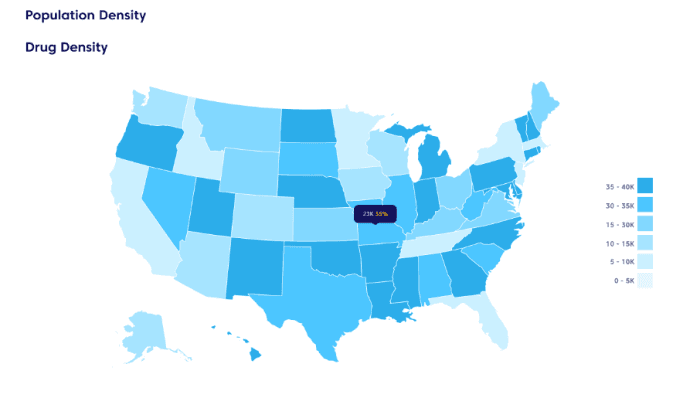
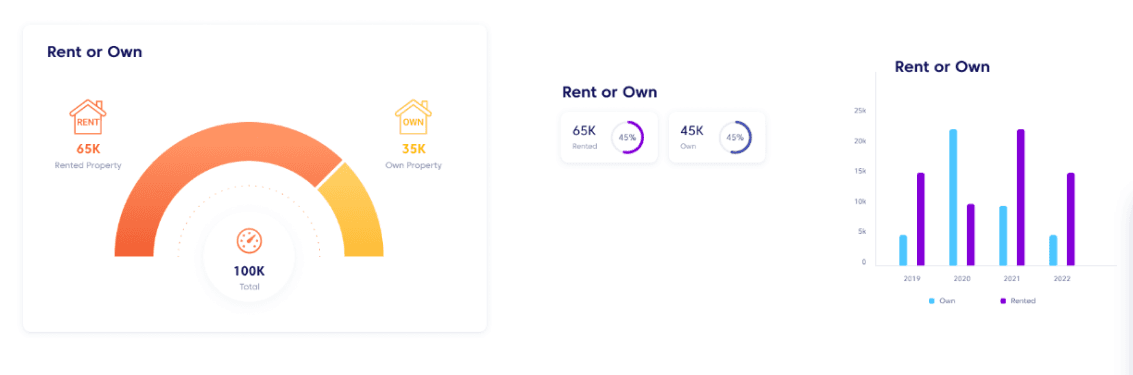
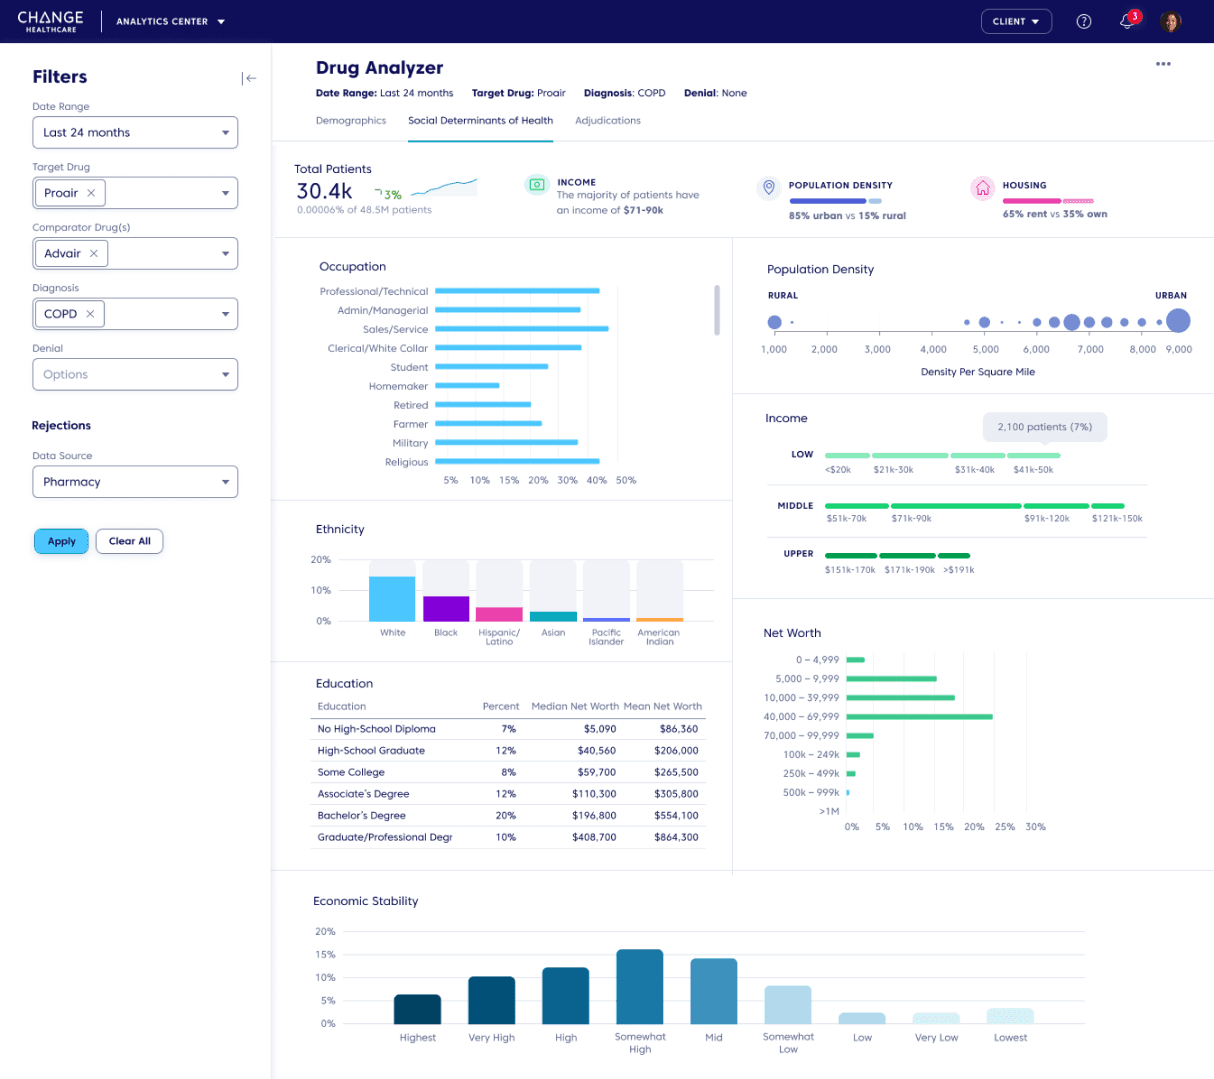
Solution Overview: Designed a dashboard that aggregates and visualizes SDOH data, providing insights into factors such as economic stability, education, healthcare access, neighborhood conditions, and social context.
Solution Details:
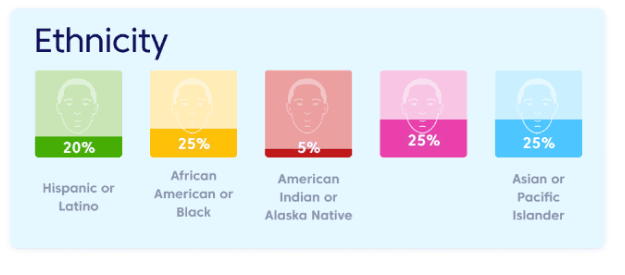
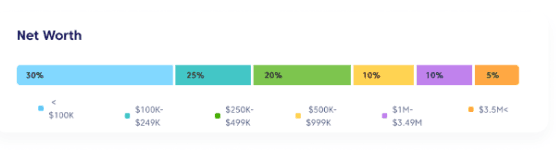
Developed visualizations for key SDOH metrics.
Integrated data from multiple sources for a holistic view.
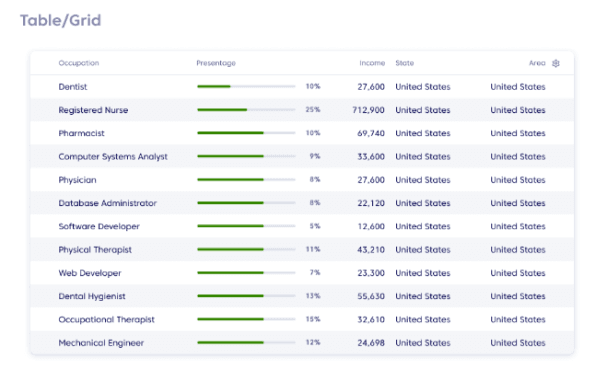
Enabled drill-down capabilities for detailed analysis.
Implemented a feature allowing users to filter data and seamlessly navigate to related dashboards, such as demographics and adjudication.
Timeline
Team: UX Designer, Project Manager
Role: UX Designer
Duration: 4 months
Tools Utilized: Figma, Tableau, Power BI, Superset
Project Goals
Enhance understanding of SDOH impacts on health outcomes.
Provide actionable insights for healthcare interventions.
Improve data accessibility and usability for healthcare professionals.
Our Process
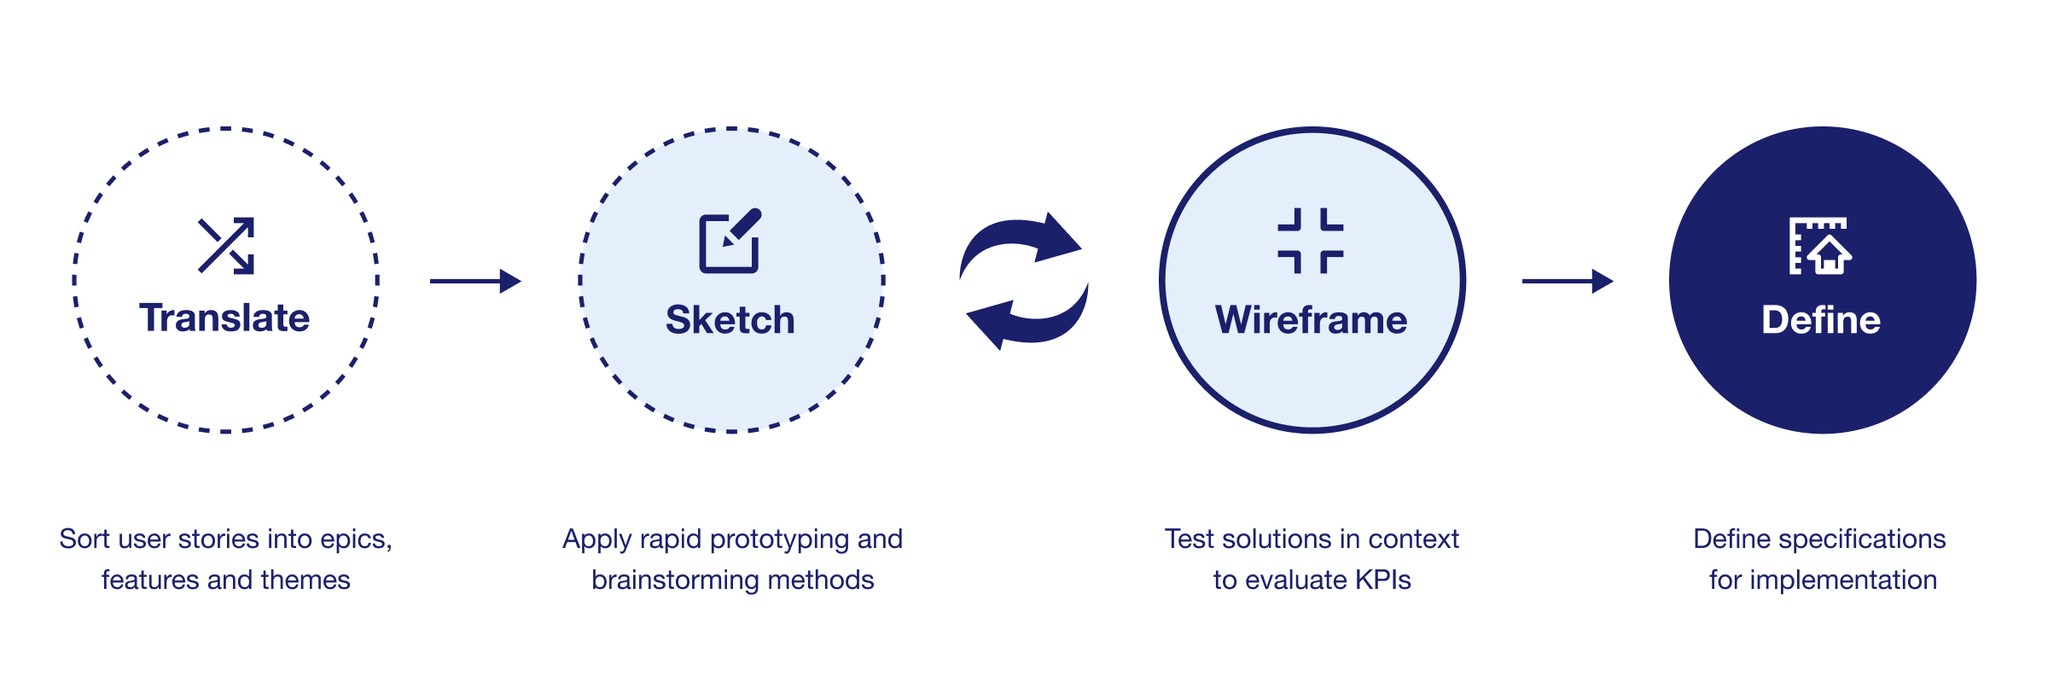
Brainstorming & Ideation
Approach: Focused on creating a comprehensive, yet user-friendly dashboard that conveys complex SDOH data in an accessible way.
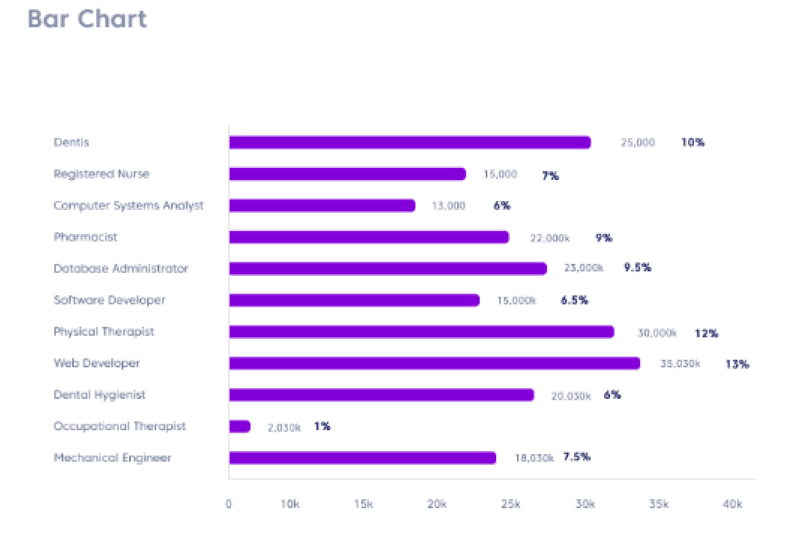
Possible Solutions: Explored various visualization techniques such as heat maps, bar charts, and scatter plots to effectively present different SDOH metrics.
Iteration
Iterative design process with multiple rounds of testing and feedback. Adjusted the interface and data visualization techniques based on user feedback.
Final Designs
Design Elements: Utilized a clean and intuitive layout with a consistent color scheme that aligns with healthcare standards.
Key Features:
Real-time data integration
Customizable data views
Comprehensive tooltips for better data interpretation
Data Filters and Navigation: Implemented filters that allow users to refine data views based on specific criteria. Added functionality for users to seamlessly jump to related dashboards, such as demographics and adjudication, for further analysis.
Conclusion
The SDOH dashboard provided a valuable tool for understanding the impact of social determinants on health outcomes. It facilitated data-driven decision-making and helped identify areas needing intervention.
Framer 2023
Amsterdam